6 Pipetting and Graphing in Excel 9/9-9/15
Procedure
Forward Pipetting Technique
- Set the pipette to the desired volume
- Attach pipette tip to your pipette
- Press the operating button to the first stop (#1).
- Dip the tip into the solution to a depth of 1 cm, and slowly release the operating button (#2). Wait 1-2 seconds and withdraw the tip from the liquid, touching it against the edge of the reservoir to remove excess liquid.
- Dispense the liquid into the receiving vessel by gently pressing the operating button to the first stop and then press the operating button to the second stop (#3). This action will empty the tip. Remove the tip from the vessel, sliding it up the wall of the vessel (#4).
- Release the operating button to the ready position.
- Expel the pipette tip into the biohazard container (don’t pull off tip with your hand)
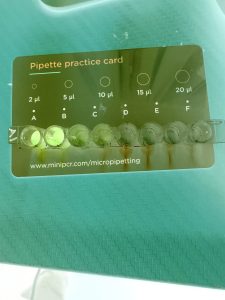
Pipetting Different Volumes and Viscosities
- Have your crystal violet, water, P2, P10, micropipette tips, and pipetting practice card on hand.
- Load the correct tip (10 ul) onto the P2 and set the volume to the first amount displayed on the practice pipetting card.
- Practice pipetting the proper amounts of water onto the card by using the forward pipetting technique described above. You can check your accuracy by comparing the water droplet to the circle size on the card.
- Practice pipetting the proper amounts using various liquids you have access to, such as the provided crystal violet or further explore different viscosities by using vegetable oil or ethanol.
Performing a Serial Dilution & Data Analysis
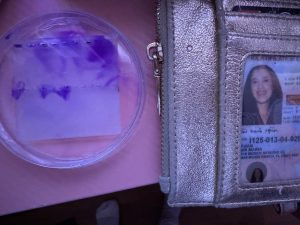
Part A) Serial Dilution
- Take 1 8-well ELISA test strip (per student)
- Label your strip on the side with your initials.
- Use the P200 pipette, attach the corresponding tip, then fill wells 1-8 with 90 μl H2O.
- Use the P20 pipette, attach a white tip and transfer 10 μl crystal violet into well 1 and 10 μl crystal violet into well 2.
- To perform your 1:100 dilutions, use a P20 pipette attach a white tip and transfer 10 μl from well 1 into well 3 – mix, repeat and transfer 10 μl from well 2 to well 4 – mix after each transfer
- To perform your 1:1000 dilution Pipette 10 μl from well 3 and add it to well 5 – mix, repeat and transfer 10 μl from well 4 to well 6 – mix after each transfer
- Leave well 7 and 8 with water only (negative control).
Part B) Data Analysis using Fiji
- Install Fiji software here. If you have issues installing Fiji, check out an installation tutorial under Resources.
- Take a photo of your serial dilution and upload it to Fiji.
- Following the video tutorial above, convert color intensity to numbers to perform data analysis.
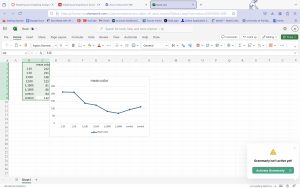
- Open your data in excel and create a graph of dilution versus color intensity for your ELN.
Part C) Making Graphs in Excel
Download Excel for Free through UF here.
- Make sure your data is well labeled (makes future steps easier)
- Highlight the data you want to graph, then click “Insert”, and under graphs choose the line graph
- Sometimes, the data looks a bit wonky. If that’s the case, click on the graph, then click “Chart” on the top options bar, and click “switch row/column”
- Once you have your graph, click on it and select “Add chart element” and add axis titles
- If you are plotting data that has been averaged, you need to make sure you add error bars. Select the line that you want to add error bars to, then under “add chart element”, select error bars -> more error bars options -> select “custom” under Error Amount in the side window that pops up. The values you will select are the corresponding standard deviations for those values.
results:
Gel loading: