
Style Guide & Examples
Charts, Graphs, and Tables
Accessibility
To ensure that charts, graphs, and tables are accessible, please refer to Penn State's guidance for Charts and Accessibility
- Provide a text description of the chart or graph (this will likely be longer than your typical alt text).
- Replicate the data as a numeric table whenever possible.
- Charts and graphs should be readable in black and white/grey scale.
- Don’t convert tables of data into images—use an actual data table instead.
- Tables must have the top row designated as header row.
- In the image settings of graphs, link to the media file so it can be clicked on to enlarge. (You can also provide this text in the footer - Note: Click on the graph to access the full-size version.)
Font
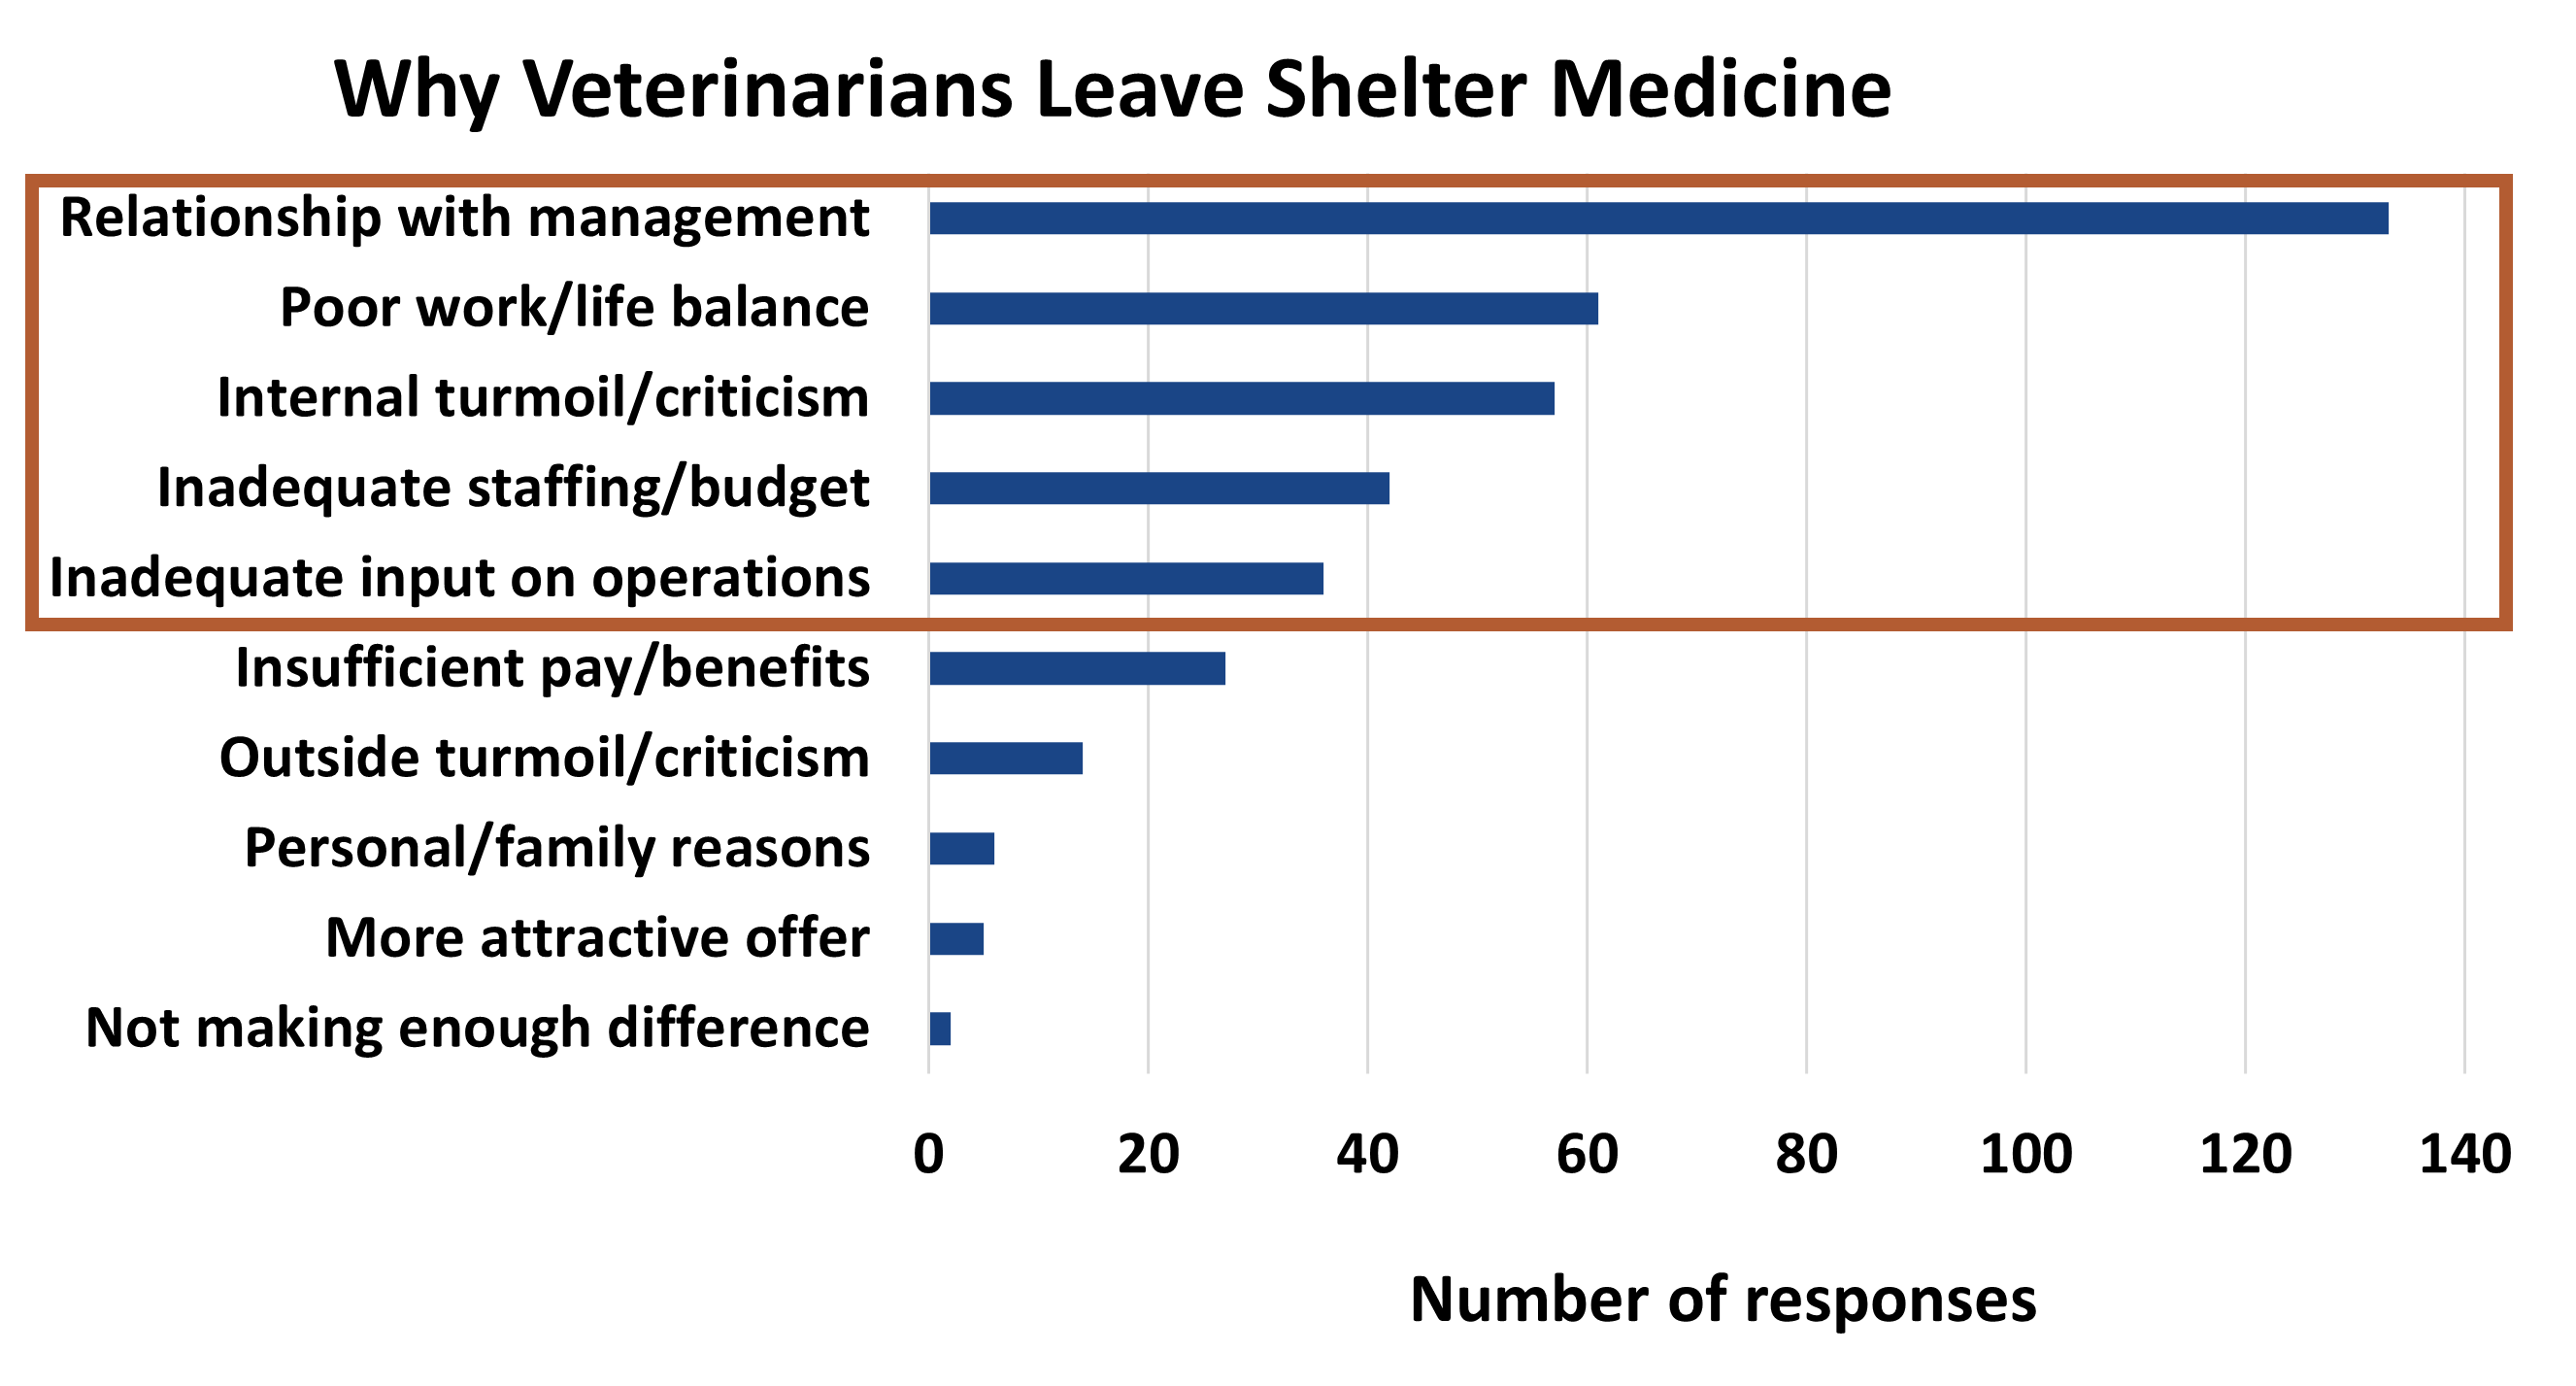
Calibri is the graphic font of choice, when available. Point size should also be consistent. Recommend 14pt bold for data labels, 16 pt bold for axis labels, and 20 pt bold for titles, as seen in the provided image.
Color Combinations
Please use the following to guide your color selection for charts, graphs, and tables:
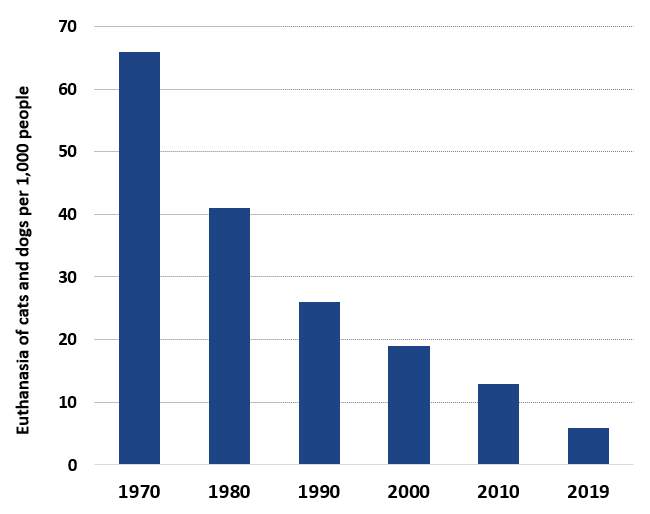
- One color: blue
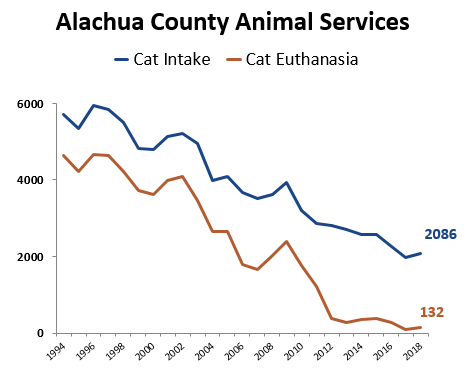
- Two colors: blue + orange (orange is add-on color 2)
- Three+ colors: blue + orange + choose a color from the provided palettes
Tables
The table style is Shaded Landscape or you can use TablePress.
Shaded Landscape
- To create the custom header row (navy with white text), add style tags in the table header tag. Ex: (may need to start by adding: <thead>)
<tr style="background-color: #112c56; color: white;"> - To ensure that the table is accessible, you must designate top row as header row: Highlight the row>select Table>Select row>Select Table Row Properties> Designate row as header
Shaded Landscape with Custom Header Row - Navy
| CATS | Year 1 | Year 2 | Year 3 | Year 4 | Year 5 |
| Intake | 18,110 | 14,656 | 12,120 | 10,695 | 10,425 |
| RTO | 191 | 147 | 113 | 106 | 100 |
| Transfer to rescue | 740 | 1,107 | 1,733 | 1,818 | 2,200 |
| Adoptions | 1,977 | 2,132 | 2,555 | 4,697 | 6,353 |
| Euthanasia | 15,202 | 11,270 | 7,719 | 4,074 | 1,772 |
| Live Release | 2,908 | 3,386 | 4,401 | 6,621 | 8,653 |
| Live Release Rate | 16% | 23% | 36% | 62% | 83% |
TablePress
Plugin Options
Add the following custom CSS to the Frontend Options and Styling field. The highlighted portion is optional and should be used for any table (in this case number 4) that should not be at 100% width of the page.
.tablepress thead th,
.tablepress tfoot th {
background-color: #112c56;
color: #ffffff;
}
.tablepress-id-4 {
width: auto;
margin: 0 auto 1em;
}
Table Settings
- Asterisk info, when present, should go in the description and select show below the table except when the asterisk is in the Title, then select show above the table
- Check Header Row, Alternating Colors, and Show Table Name
- Uncheck Row Hover Highlighting, and Use DataTables (JavaScript library)
TablePress Example
| CATS | Year 1 | Year 2 | Year 3 | Year 4 | Year 5 |
|---|---|---|---|---|---|
| Intake | 18,110 | 14,656 | 12,120 | 10,695 | 10,425 |
| RTO | 191 | 147 | 113 | 106 | 100 |
| Transfer to rescue | 740 | 1,107 | 1,733 | 1,818 | 2,200 |
| Adoptions | 1,977 | 2,132 | 2,555 | 4,697 | 6,353 |
| Euthanasia | 15,202 | 11,270 | 7,719 | 4,074 | 1,772 |
| Live Release | 2,908 | 3,386 | 4,401 | 6,621 | 8,653 |
| Live Release Rate | 16% | 23% | 36% | 62% | 83% |
