
Modules – Skills & Tools
Pipetting & Graphing in Excel
Background Information
WHY YOU SHOULD CARE ABOUT…
One of the most fundamental tools of anyone working in a lab is to use micro-pipettes properly, accurately and precisely. This exercise should teach you the fundamentals of pipetting, dilutions and graphing and interpreting your data. Learning how to use the correct pipettes with accuracy and precision is crucial to having success in the lab.
Learning Objectives
After completing this module, students will be able to:
- Recall new vocabulary and definitions that pertain to this module.
- Use appropriate microbiological and molecular lab equipment and methods: pipettes.
- Use appropriate microbiological and molecular lab equipment and methods: spectrophotometer.
- Analyze and interpret results from a variety of data.
- Use mathematical reasoning and graphing skills to solve problems in microbiology.
- Explain the role of dilutions in laboratory research and diagnostics.
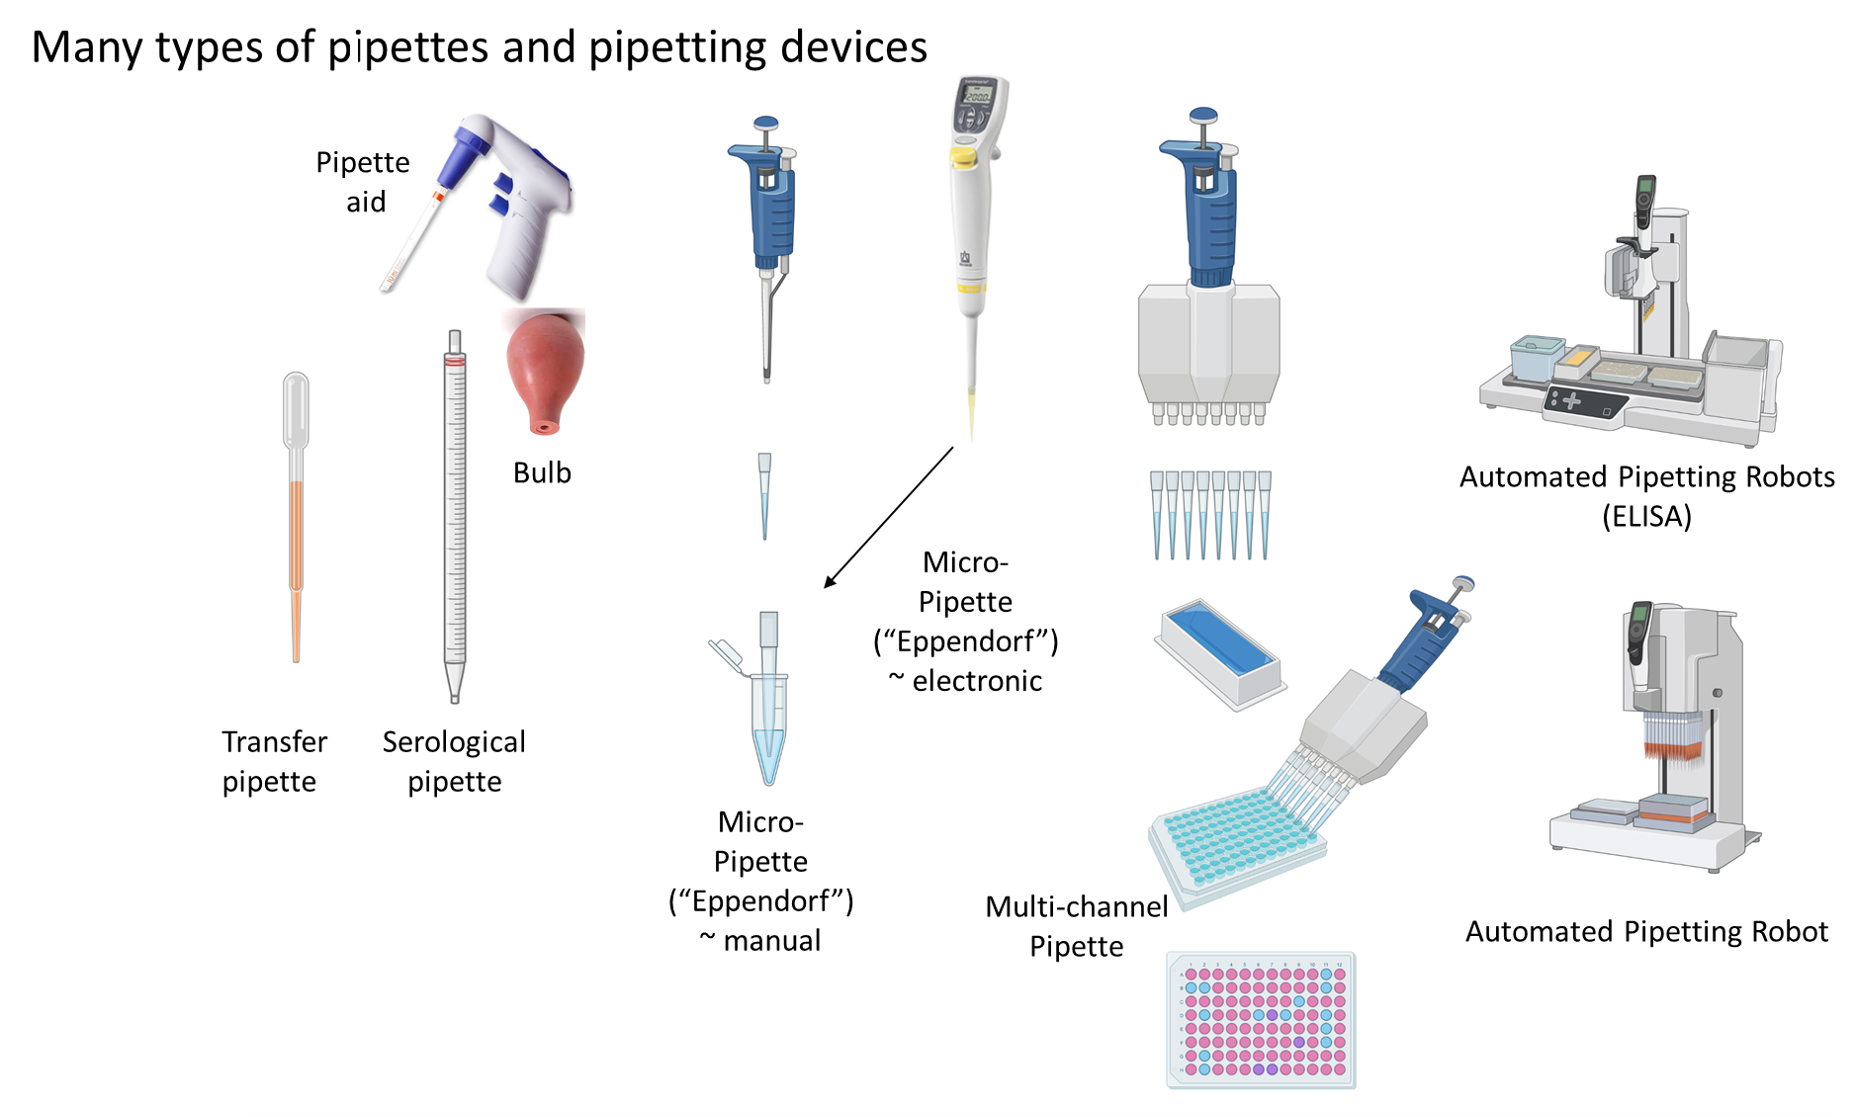
- Chose the correct liquid handling device for different experiments
History Connections
Origins of the Pipette: Why Today’s Scientists Don’t Need to Use Their Mouths. Today it is unthinkable and against EH&S (Environmental Health and Safety) rules to pipette anything by mouth, a method which was still common only 50-60 years ago. That changed when in 1961 a patent for a “‘device for the fast and exact pipetting of small liquid volumes” was granted and the “Marburg pipette” became popular in Germany and beyond. Eppendorf was the original company to produce pipettes commercially and they are still today the leading manufacturer for pipettes, hence most micropipettes are called Eppendorf pipettes (and they are used with small containers, called Eppendorf tubes). The name Eppendorf is actually a district of Hamburg, Germany and the company was founded by Heinrich Netheler and Hans Hinz in 1945. Today there are many different pipetting devices, including automated robots.
Virtual Lab Simulations
Micropipetting Simulation
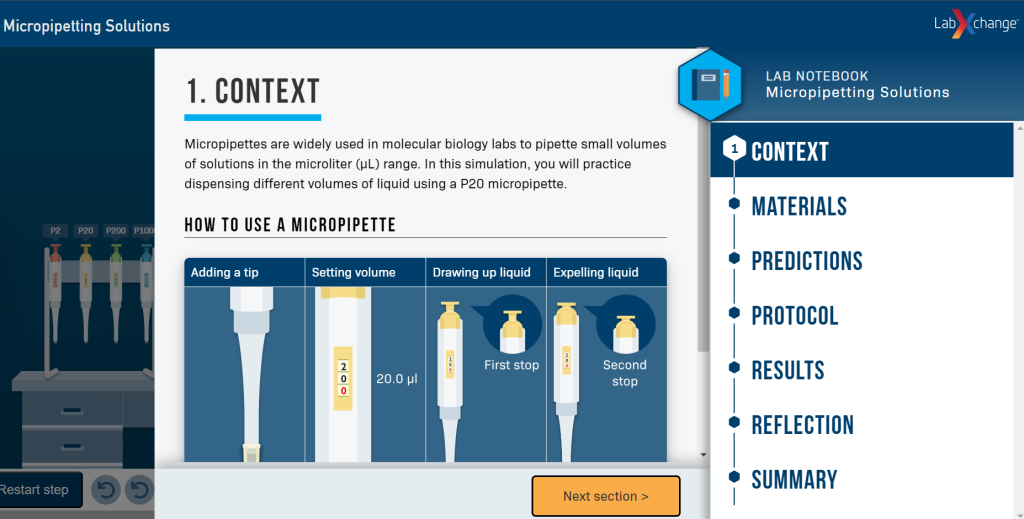
Online Lab
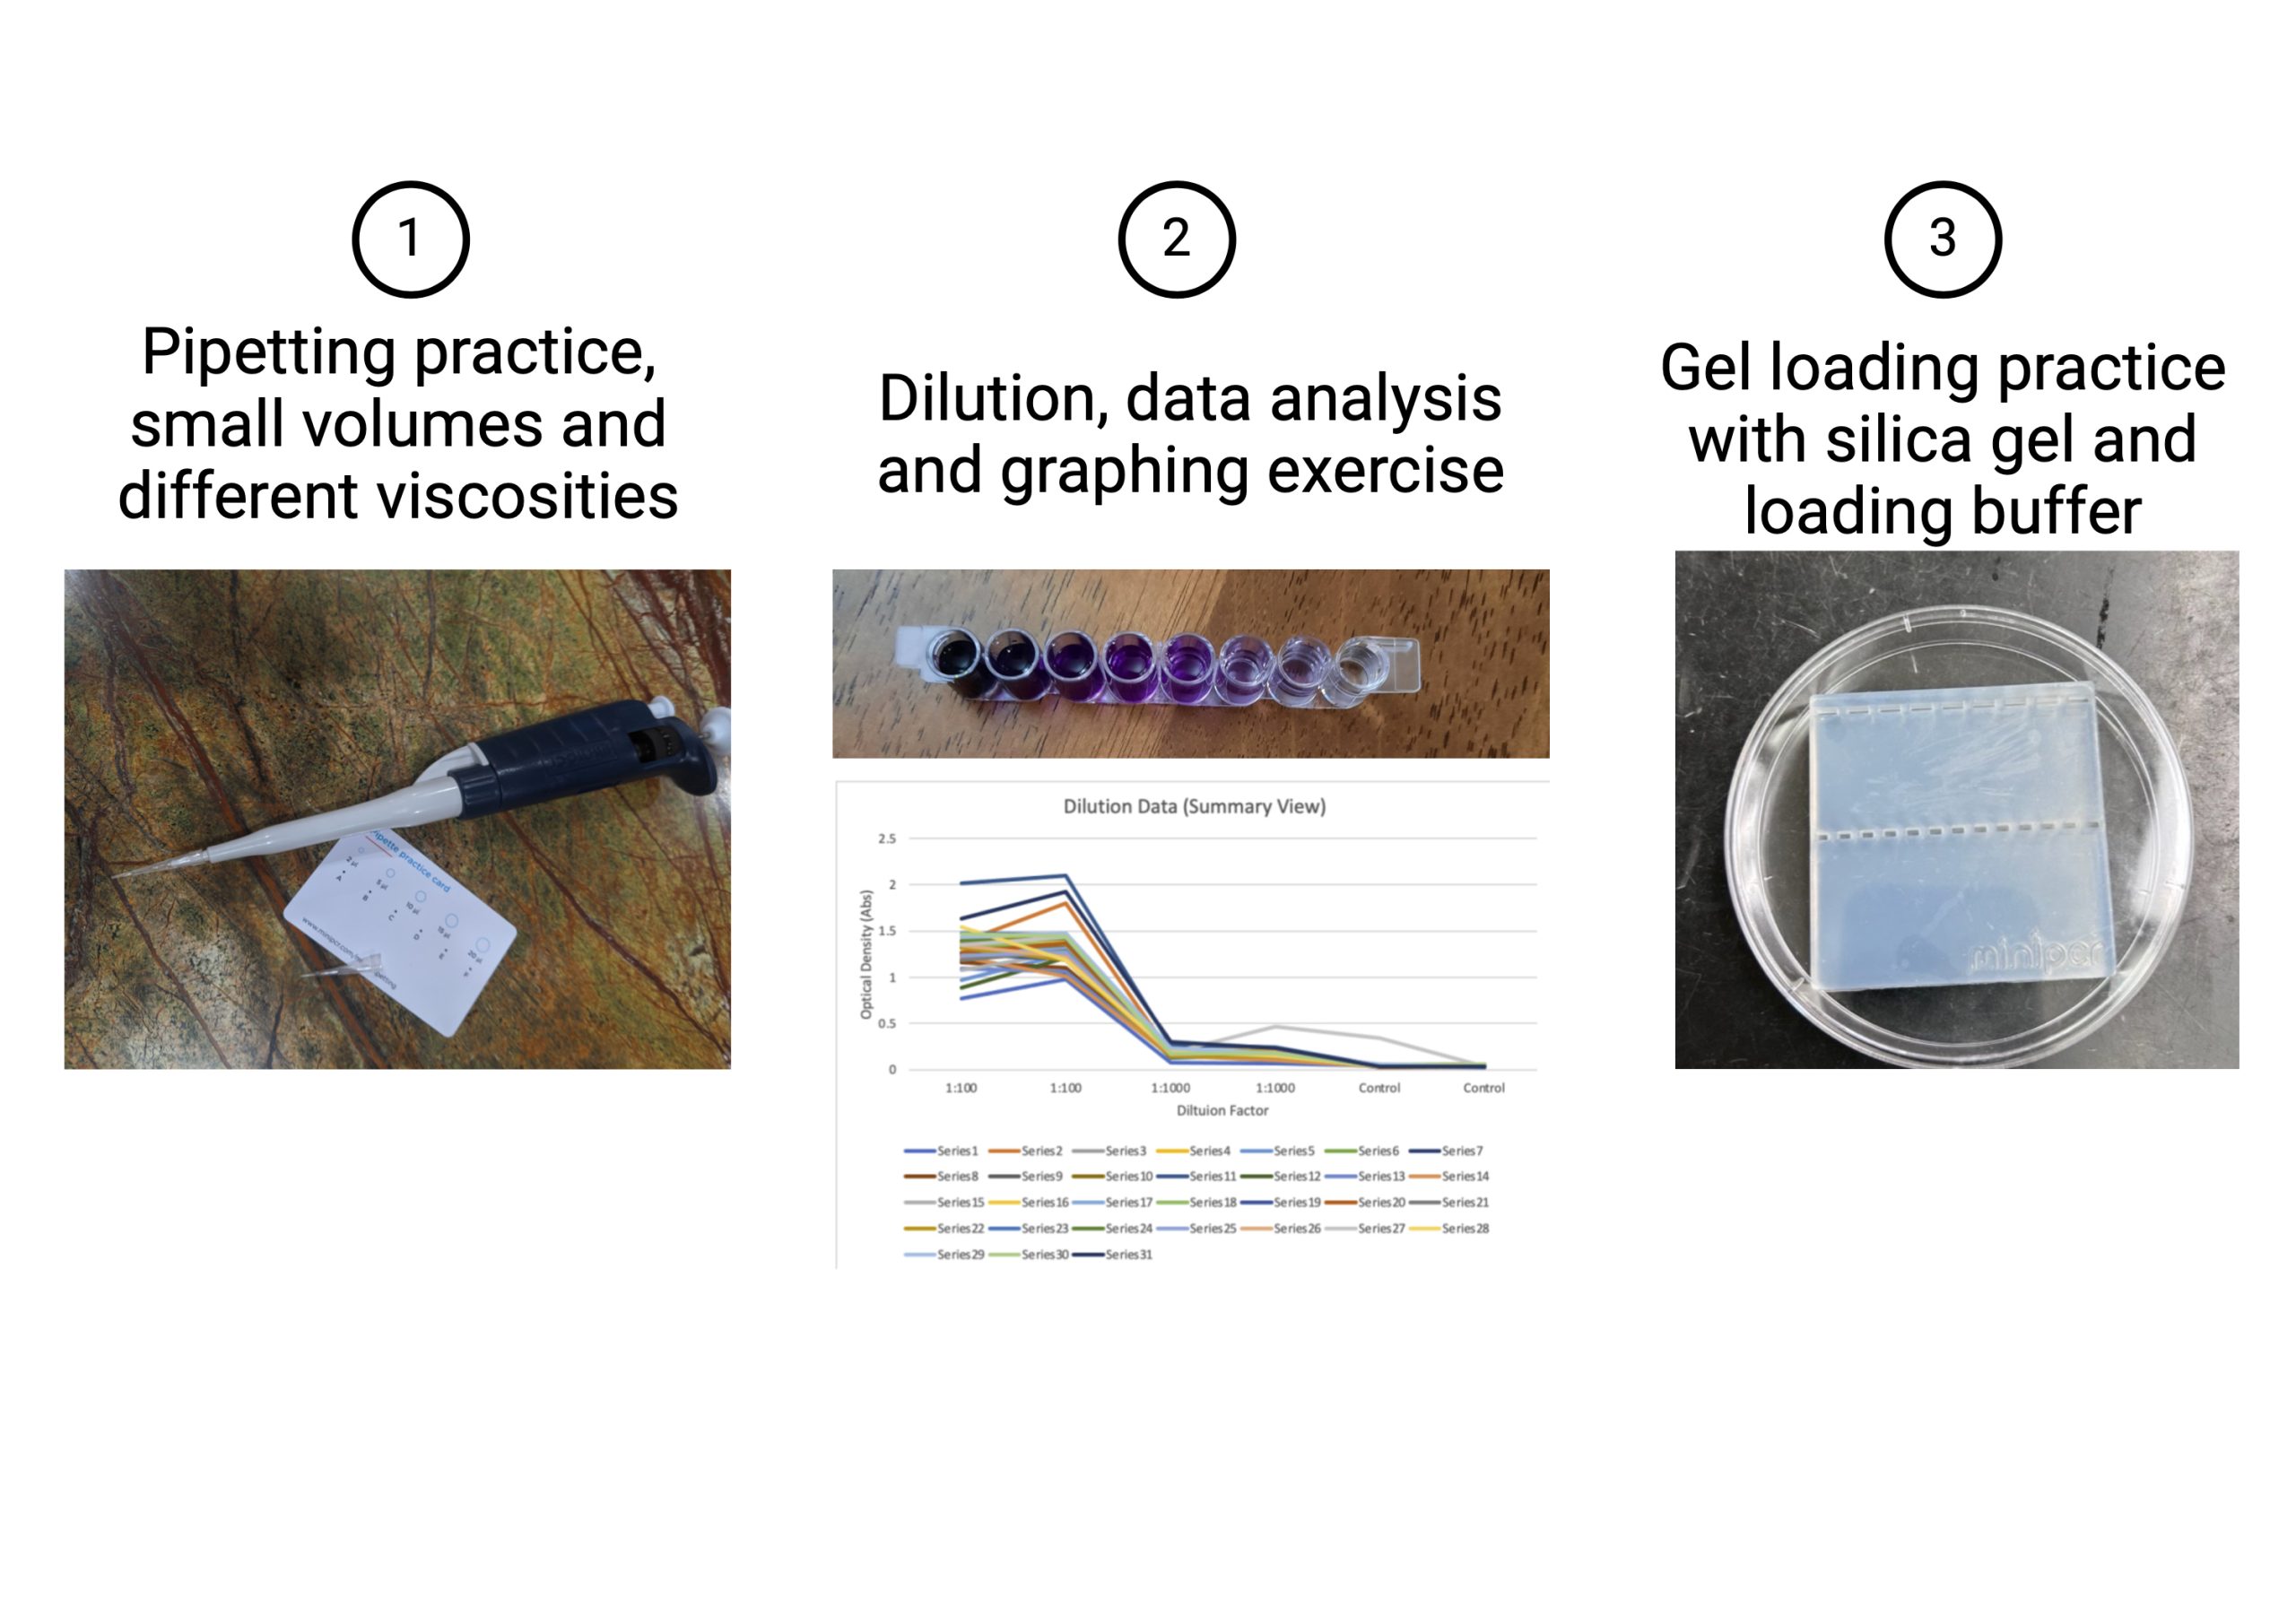
Activity: Build pipetting skills through the following practice activities:
-
Pipette different volumes and viscosities on a practice pipette card.
-
Perform a serial dilution for pipetting precise volumes and use Fiji to graph your data to closer examine your results.
-
Practice gel loading for pipetting with accuracy (this can be done later for molecular diagnostics).
Lab Kit Materials for this Activity:
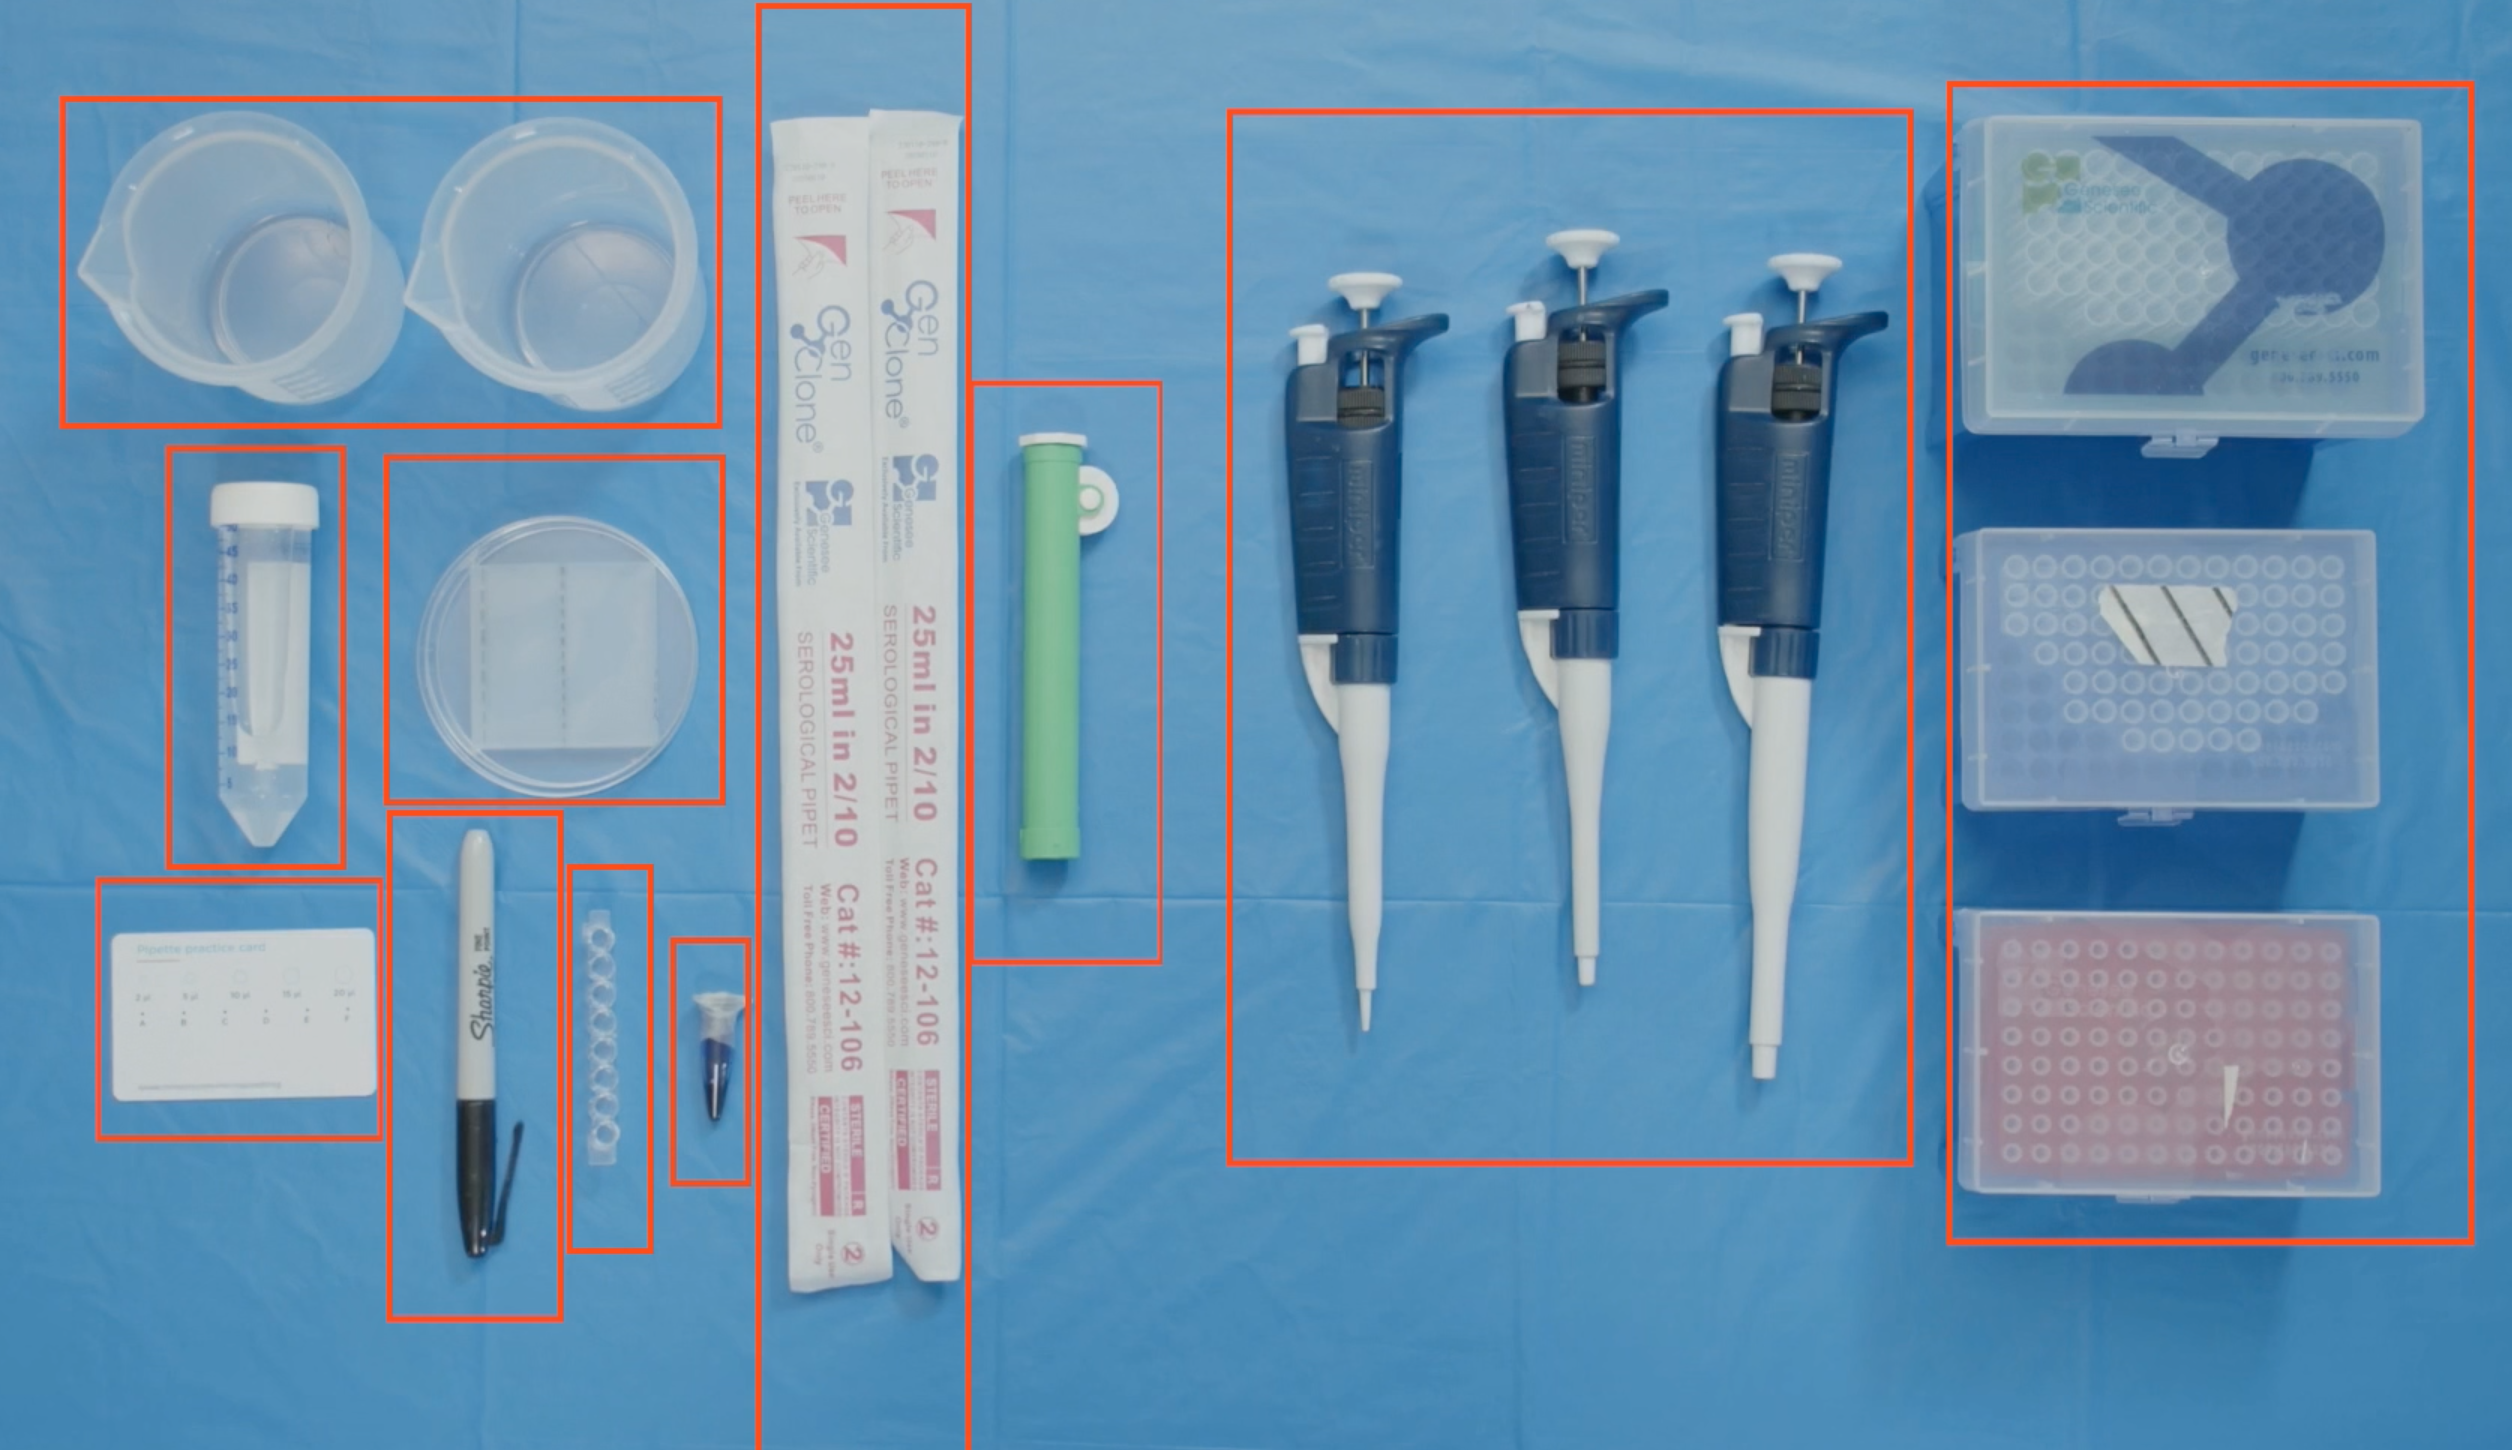
- Pipettors: P10, P200, P1000
- Pipette tips: 10, 200, 1000
- Micropipette card
- 8-well strip
- Crystal Violet
- Plastic beaker
- Loading Dye
- Serological Pipetter (Green)
- Serological 25 mL Pipette tip
- Sharpie
- Petri dish with silica gel
- Water (self-provided)
Video Tutorials
Introduction to Pipetting & Using Micropipette Card
Serial Dilutions
Using Fiji to Graph Results
Practicing Gel Loading
How to Use a Serological Pipettor
Filmed & To Be Uploaded
Procedure
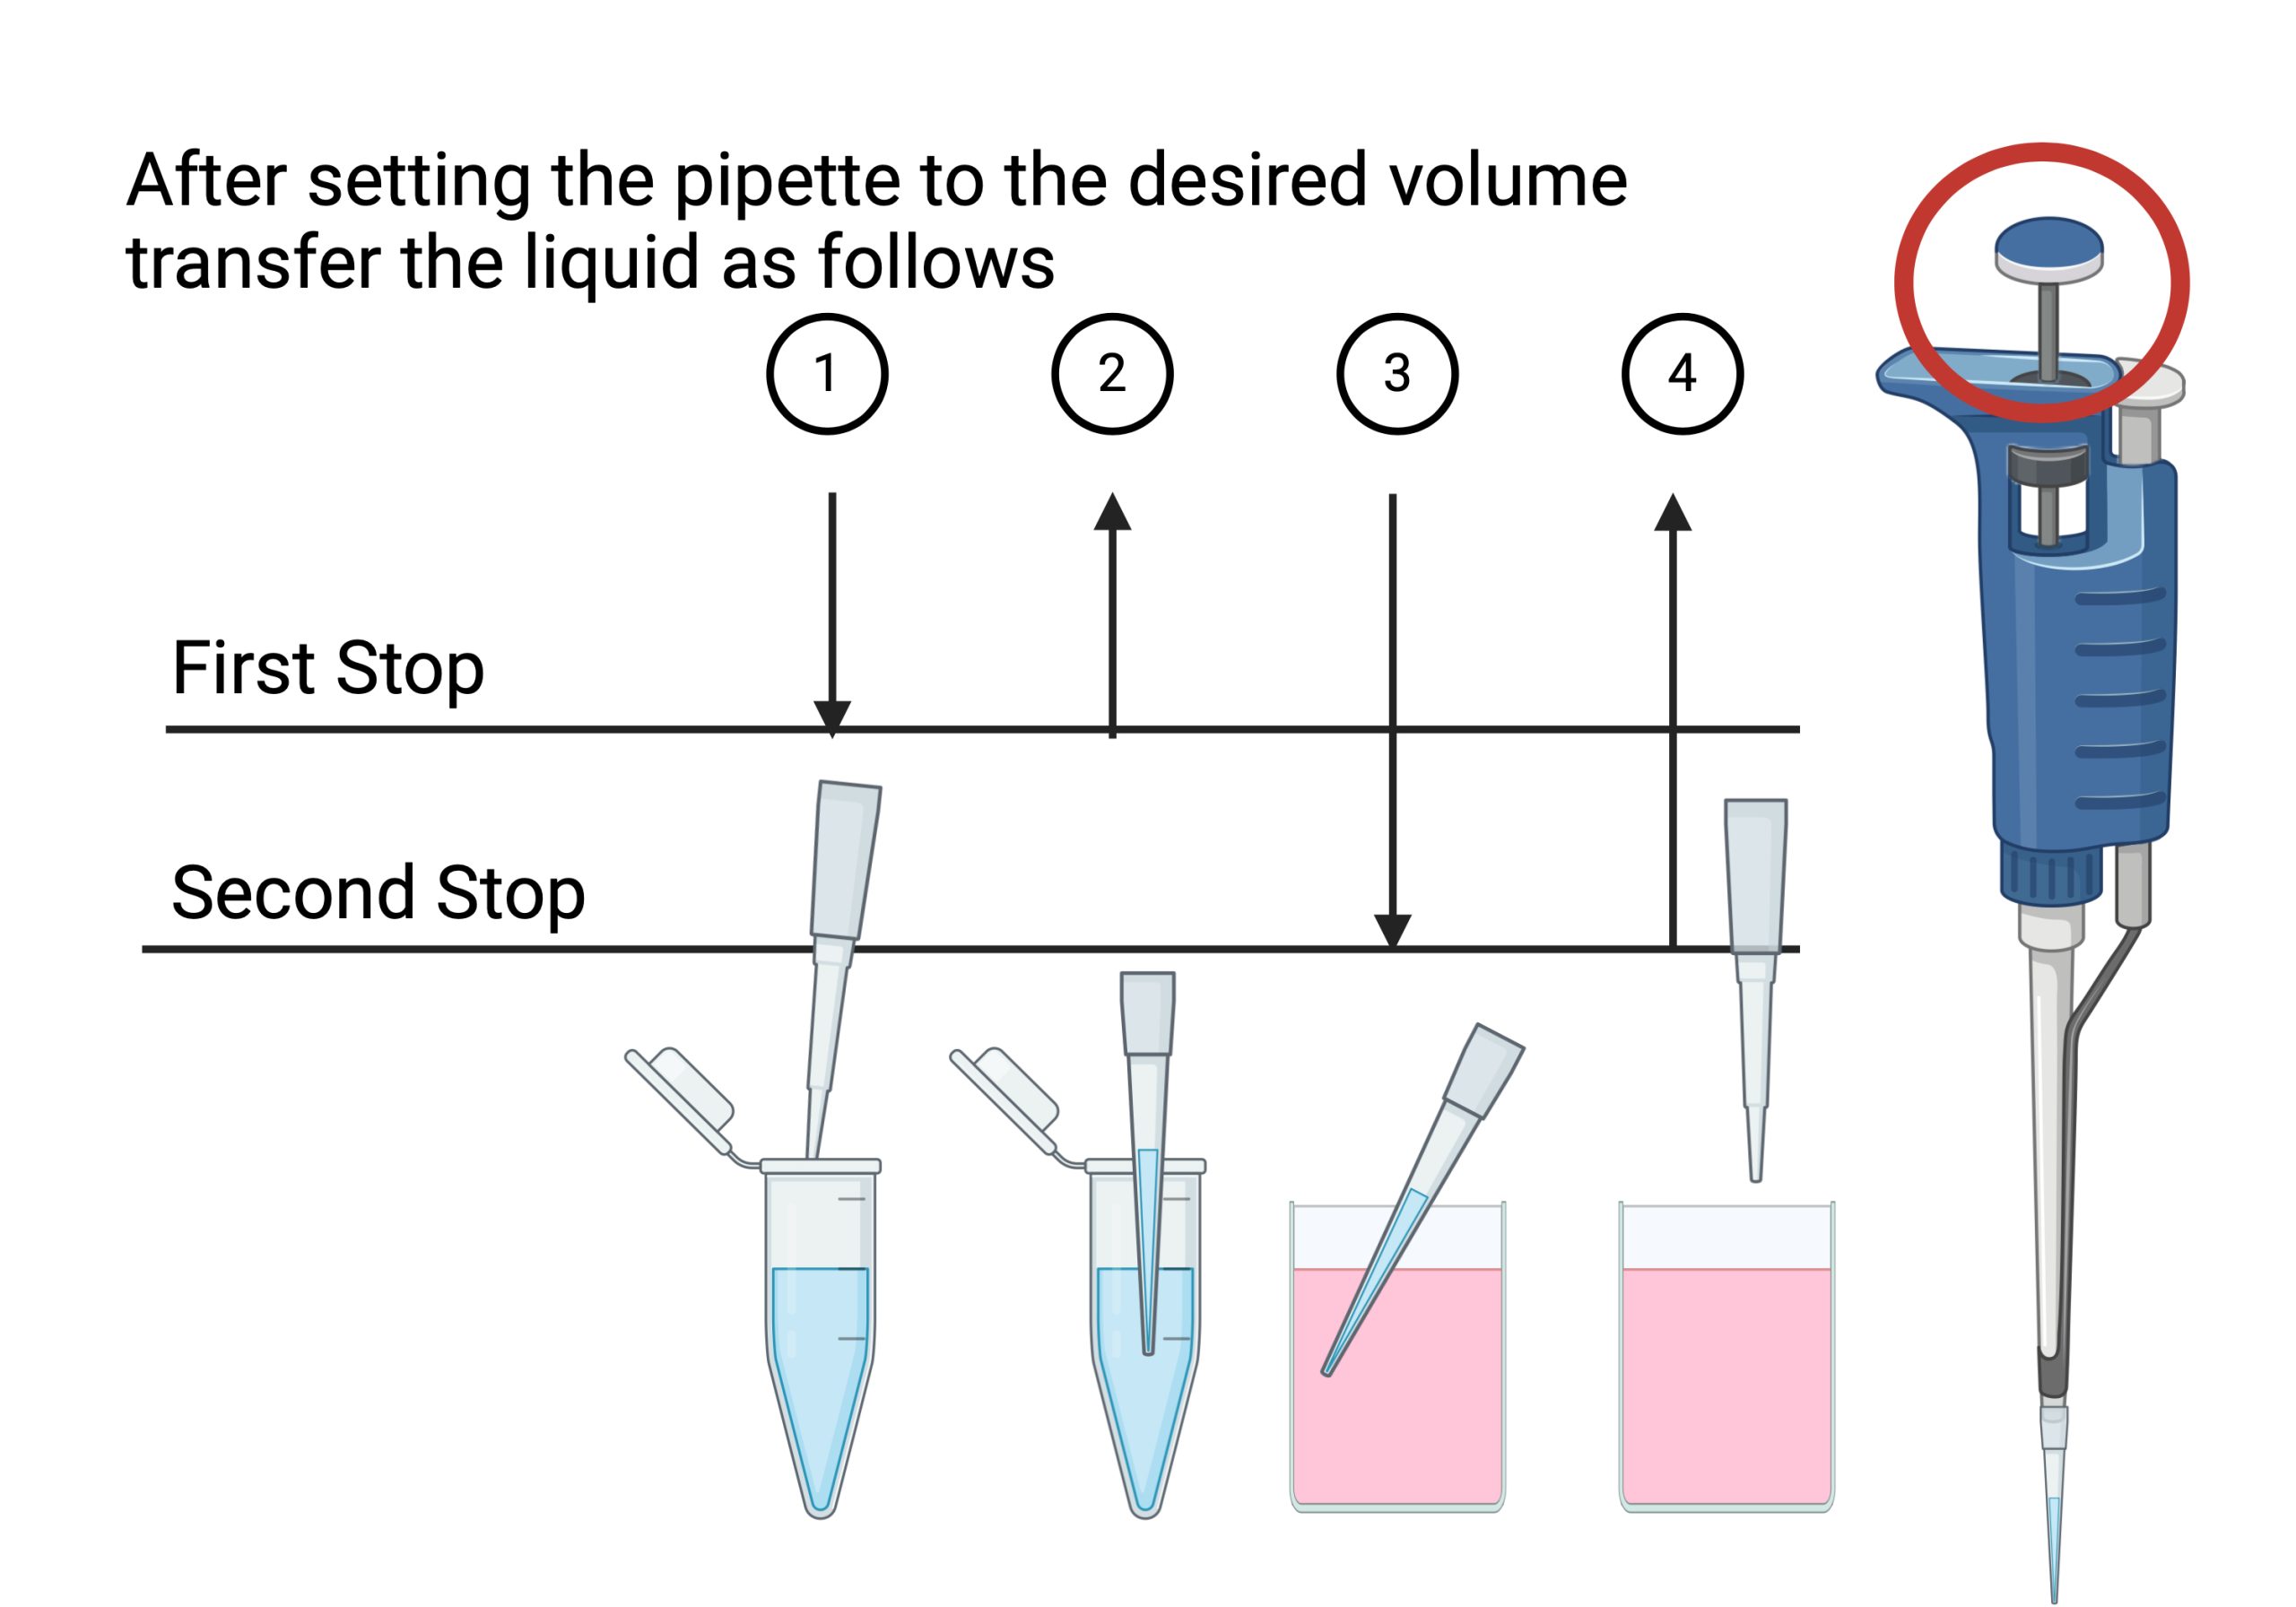
Forward Pipetting Technique
- Set the pipette to the desired volume
- Attach pipette tip to your pipette
- Press the operating button to the first stop (#1).
- Dip the tip into the solution to a depth of 1 cm, and slowly release the operating button (#2). Wait 1-2 seconds and withdraw the tip from the liquid, touching it against the edge of the reservoir to remove excess liquid.
- Dispense the liquid into the receiving vessel by gently pressing the operating button to the first stop and then press the operating button to the second stop (#3). This action will empty the tip. Remove the tip from the vessel, sliding it up the wall of the vessel (#4).
- Release the operating button to the ready position.
- Expel the pipette tip into the biohazard container (don’t pull off tip with your hand)
Pipetting Different Volumes and Viscosities
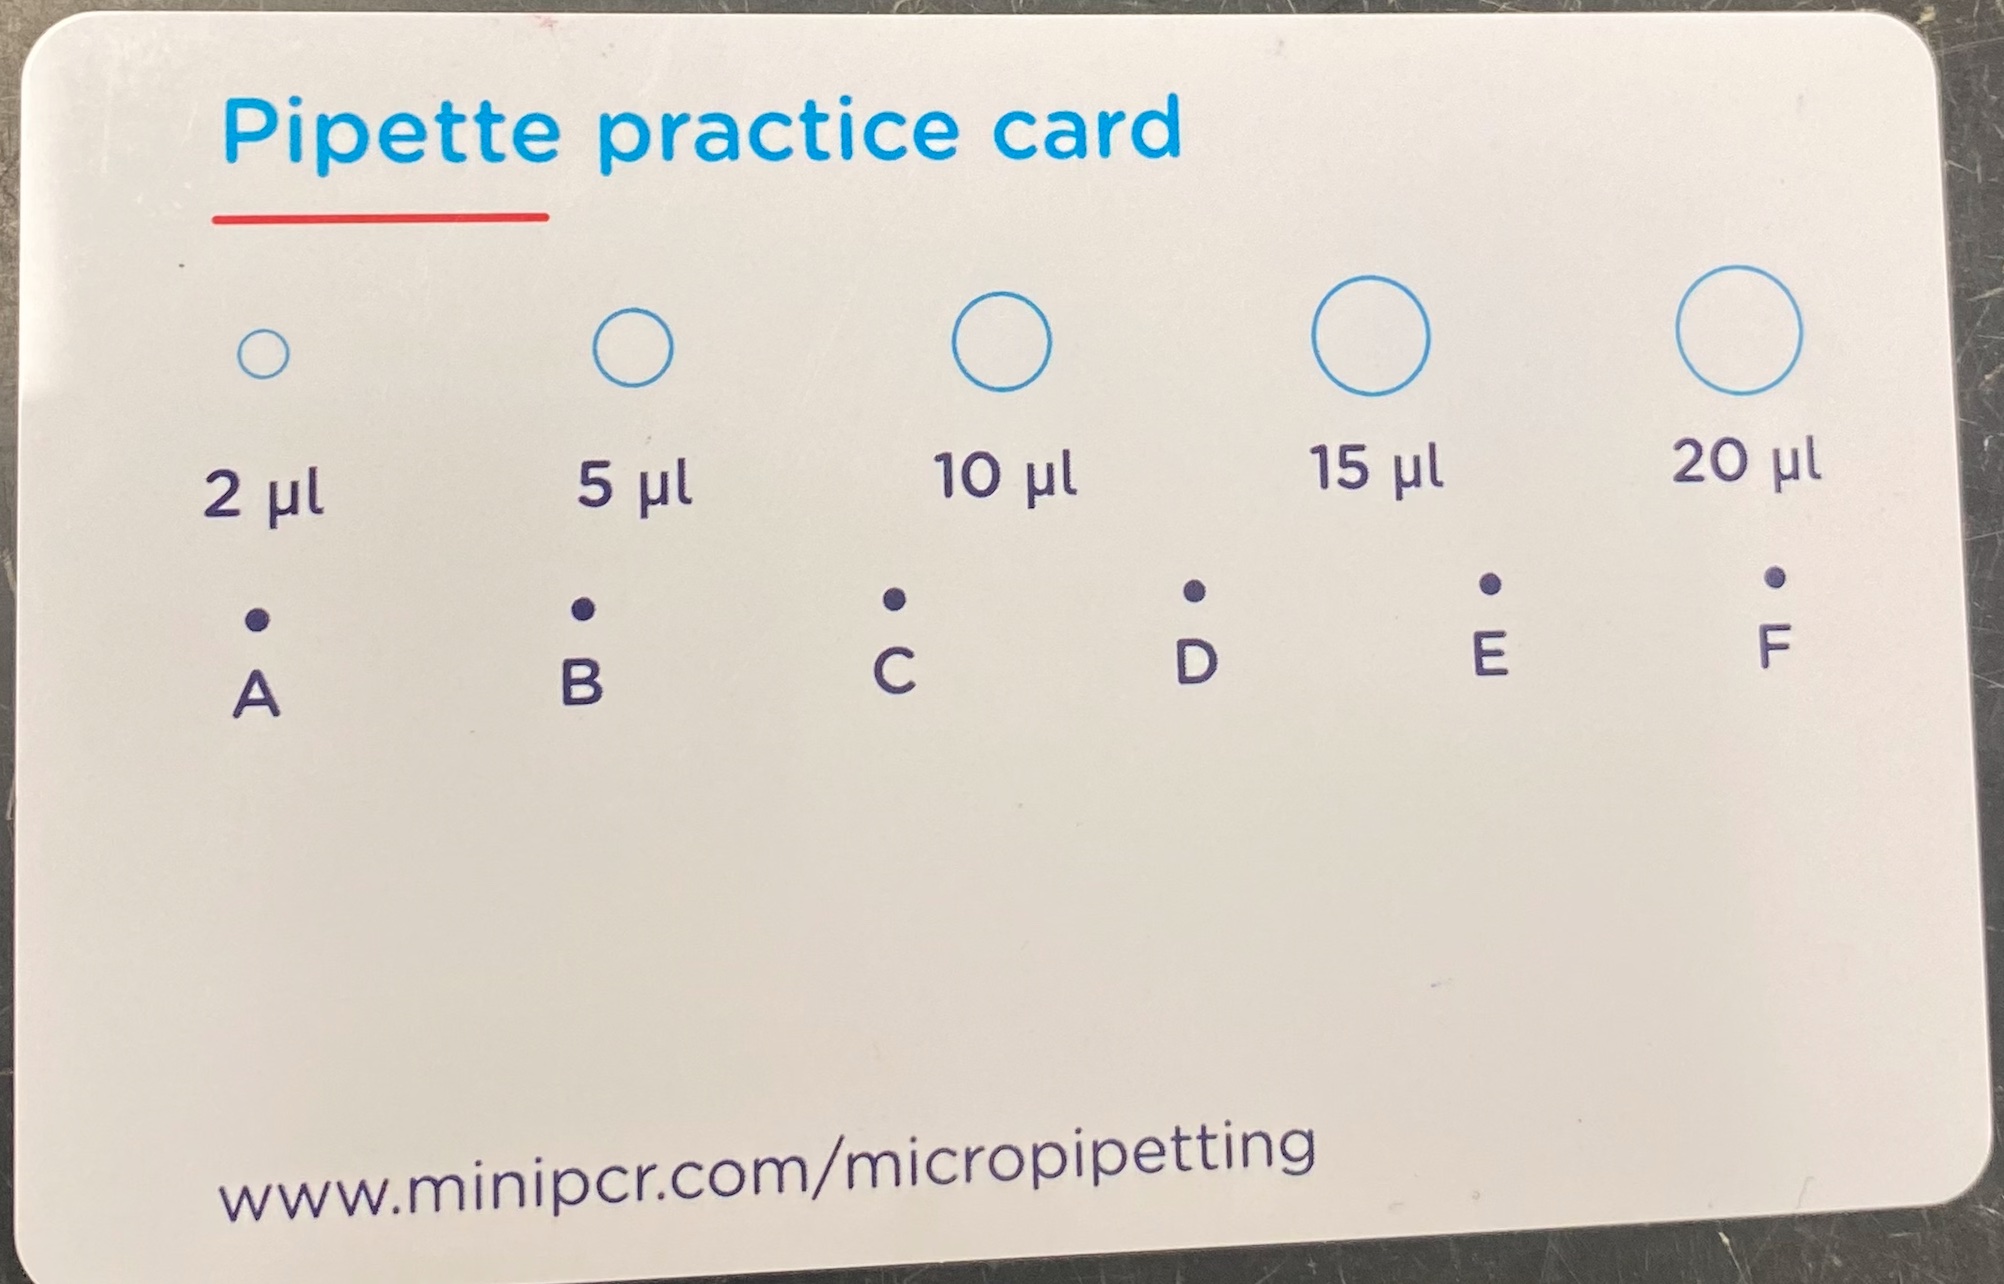
- Have your crystal violet, water, P2, P10, micropipette tips, and pipetting practice card on hand.
- Load the correct tip (10 ul) onto the P2 and set the volume to the first amount displayed on the practice pipetting card.
- Practice pipetting the proper amounts of water onto the card by using the forward pipetting technique described above. You can check your accuracy by comparing the water droplet to the circle size on the card.
- Practice pipetting the proper amounts using various liquids you have access to, such as the provided crystal violet or further explore different viscosities by using vegetable oil or ethanol.
Performing a Serial Dilution & Data Analysis
Part A) Serial Dilution
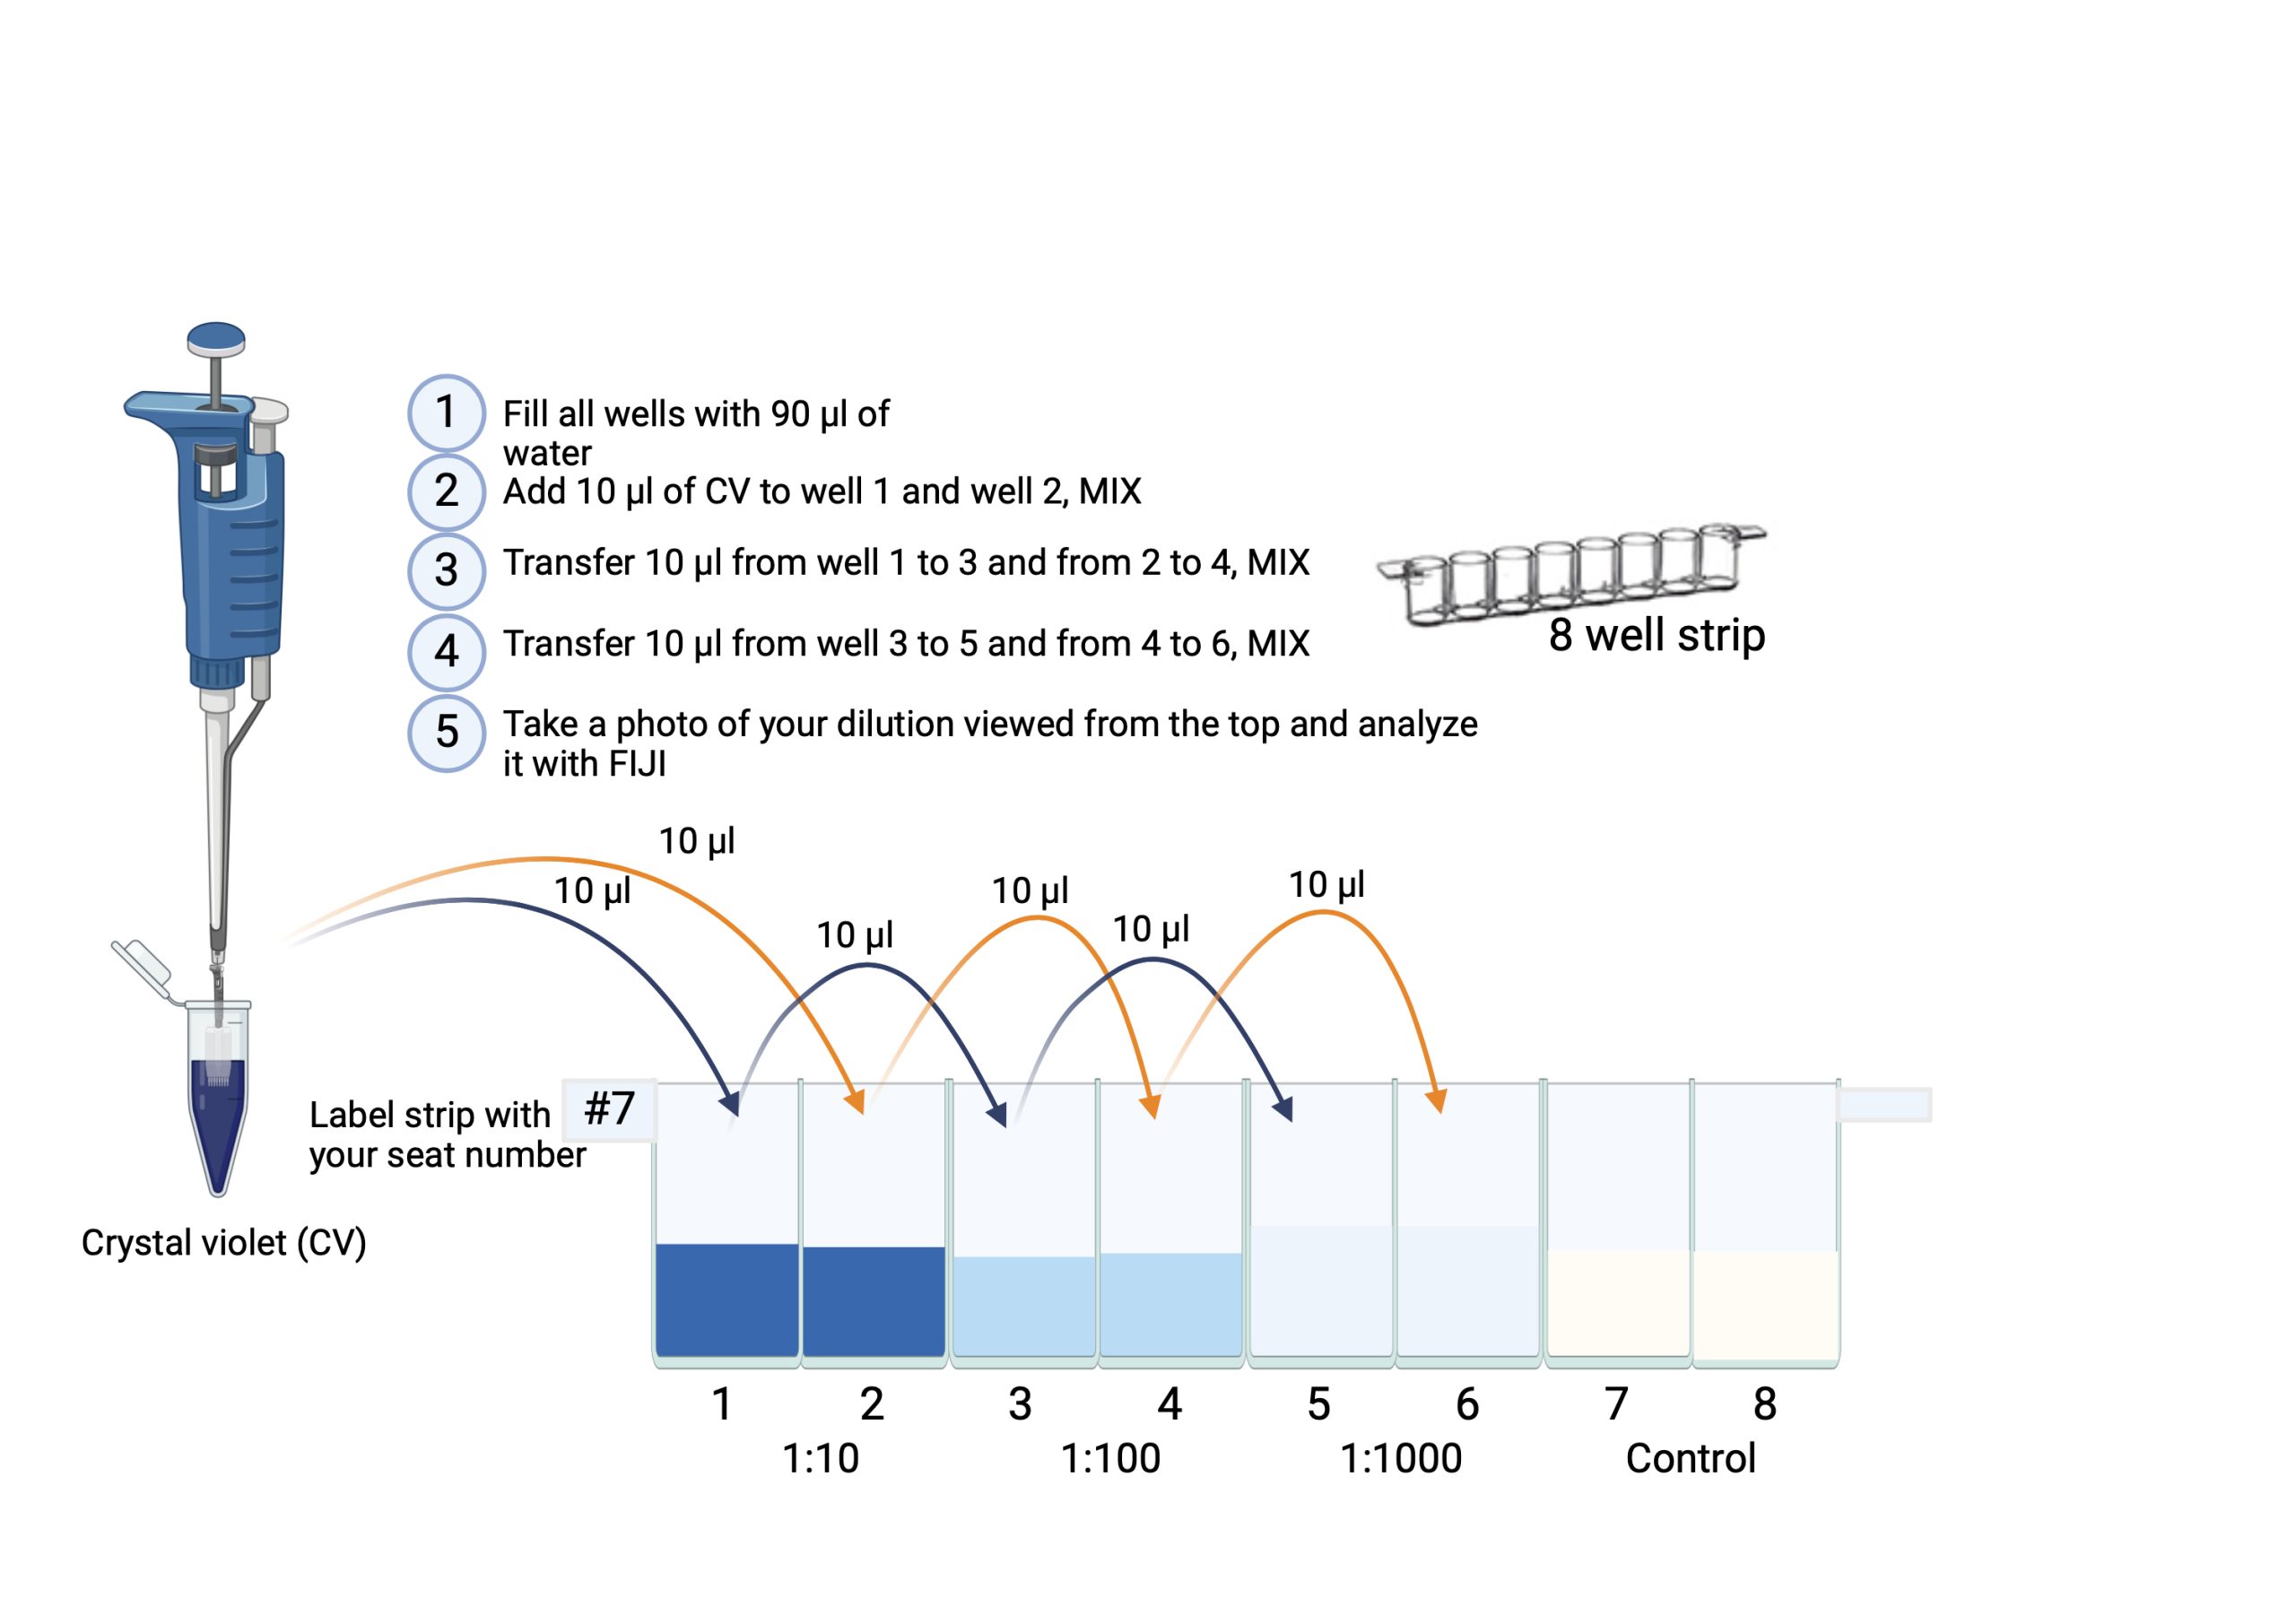
- Take 1 8-well ELISA test strip (per student)
- Label your strip on the side with your initials.
- Use the P200 pipette, attach the corresponding tip, then fill wells 1-8 with 90 μl H2O.
- Use the P20 pipette, attach a white tip and transfer 10 μl crystal violet into well 1 and 10 μl crystal violet into well 2.
- To perform your 1:100 dilutions, use a P20 pipette attach a white tip and transfer 10 μl from well 1 into well 3 – mix, repeat and transfer 10 μl from well 2 to well 4 – mix after each transfer
- To perform your 1:1000 dilution Pipette 10 μl from well 3 and add it to well 5 – mix, repeat and transfer 10 μl from well 4 to well 6 – mix after each transfer
- Leave well 7 and 8 with water only (negative control).
Part B) Data Analysis using Fiji
- Install Fiji software here. If you have issues installing Fiji, check out an installation tutorial under Resources.
- Take a photo of your serial dilution and upload it to Fiji.
- Following the video tutorial above, convert color intensity to numbers to perform data analysis.
- Open your data in excel and create a graph of dilution versus color intensity for your ELN.
Part C) Making Graphs in Excel
Download Excel for Free through UF here.
- Make sure your data is well labeled (makes future steps easier)
- Highlight the data you want to graph, then click “Insert”, and under graphs choose the line graph
- Sometimes, the data looks a bit wonky. If that’s the case, click on the graph, then click “Chart” on the top options bar, and click “switch row/column”
- Once you have your graph, click on it and select “Add chart element” and add axis titles
- If you are plotting data that has been averaged, you need to make sure you add error bars. Select the line that you want to add error bars to, then under “add chart element”, select error bars -> more error bars options -> select “custom” under Error Amount in the side window that pops up. The values you will select are the corresponding standard deviations for those values.
Gel Loading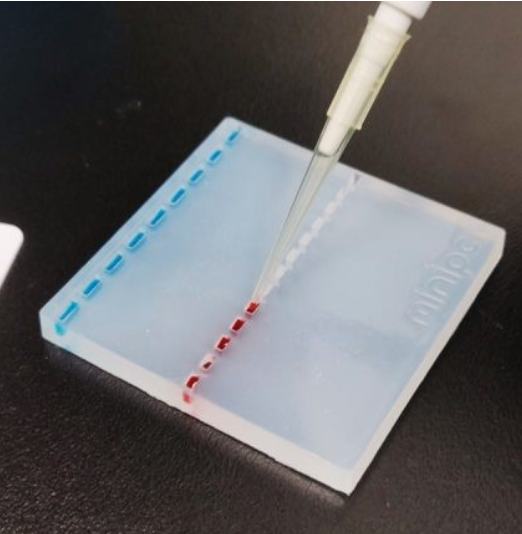
- Use the silica gel in the Petri dish.
- Fill up the dish with tap water to immerse the gel.
- Use 3-5 μl of the loading dye and carefully fill the wells using the forward pipetting technique.
- Repeat with large and small wells until you feel comfortable.
- Take an authenticated photo for your ELN.
- Wash the gel properly and rinse with EtOH if the dye stays in the gel.
Results
Document the following in your ELN:
Upload pictures from all 3 activities to your ELN along with your data analysis results, including your graph. Make sure to discuss any difficulties you faced during these activities, along with how good precision and accuracy is important when it comes to pipetting. Include any relevant information and tips about pipetting and graphing, such as how pipetting with different volumes and viscosities affects your technique.
In-Person Lab
Activity: Pipetting & Graphing In-Person Procedure
Video Tutorials
Pipetting & Serial Dilutions
Graphing & Data Analysis On Excel
Resources
- Take a look at the appropriate module for the vocabulary that is being tested: Microbiology @ UF Lab Terminology Quizlet
- Pipetting Video
- How to make your graphs for pipetting exercise
- Spectrophotometry
- Guide to pipetting
- Installing Fiji
Graphing in Excel
Download Excel for Free through UF here.
How to use equations on excel (like mean and std dev.):
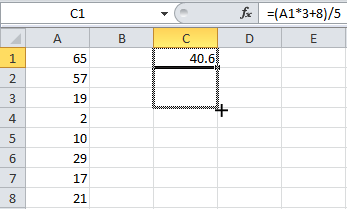
1. Typing the equal sign (=) on excel will put it in equation mode. You can either manually type out the equations, or click the fx button, which will show all of the functions for you. The main two functions we will be using is the average function [ =AVERAGE() ], and the std dev function [ STDEV.P() ] or [STDEV() ] (both work the same, just choose one).
2. When prompted, highlight the data you want to apply the functions to
3. Tip: To save time, you can drag the corner of a cell that has a formula on it to apply that same formula to other cells (that way it saves you some time). Sometimes excel doesn’t do what you want it to, so always double check that when you drag it, the formula properly targets the cells you want it to!
Like this:
Making Line Graphs with error bars:
1. Make sure your data is well labeled (makes future steps easier)
2. Highlight the data you want to graph, then click “Insert”, and under graphs choose the line graph
3. Sometimes, the data looks a bit wonky. If that’s the case, click on the graph, then click “Chart” on the top options bar, and click “switch row/column”
4. Once you have your graph, click on it and select “Add chart element” and add axis titles
5. If you are plotting data that has been averaged, you need to make sure you add error bars. Select the line that you want to add error bars to, then under “add chart element”, select error bars -> more error bars options -> select “custom” under Error Amount in the side window that pops up. The values you will select are the corresponding standard deviations for those values.
