
Module 6: The Case of the Overwhelmed Shelter
Housing Capacity
The graph below shows the number of dogs in a shelter each day from January to December in Year 1 vs. Year 2. The number of dogs admitted in each year was the same. The reason there were more dogs in the shelter per day in Year 2 was that the average LOS increased from 8 days in Year 1 to 12 days in Year 2.
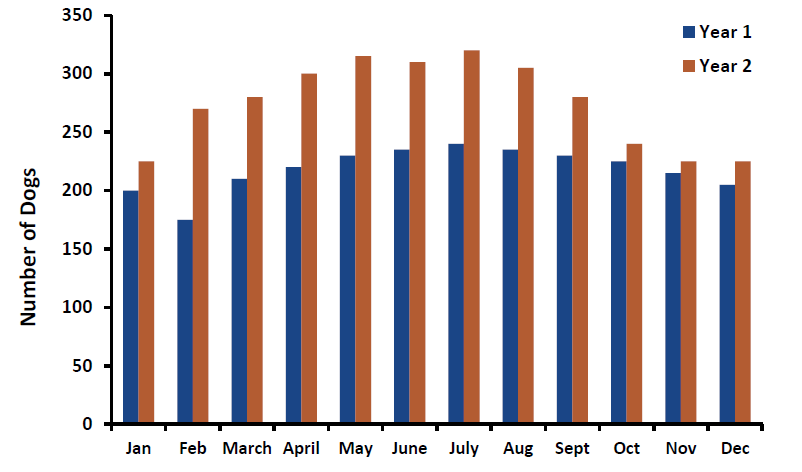
HOUSING CAPACITY is the number of runs, preferably double-sided runs, appropriate for housing one dog each. The shelter represented by the graph above has 250 double-sided runs for a housing capacity of 250 dogs on a daily basis. Examine the graph more closely – notice the number of dogs in the shelter for most months in Year 1 was within the housing capacity. The number of dogs exceeded the housing capacity for most months in Year 2 when the average LOS increased by only 4 days.
According to the ASV Guidelines regarding capacity for care, staying within the housing capacity is a MUST PRACTICE. LOS has the most profound impact on staying within the housing capacity.
Test Your Knowledge
