Module 6: The Case of the Overwhelmed Shelter
Using Data to Analyze Trends in Shelter Admissions
The most useful information about changes in a shelter’s life-saving capacity is derived from analyzing trends in intake, outcomes, the number of animals released alive, and the number euthanized over time. These analyses can provide a big picture perspective about shelter performance and what areas to focus on to improve live release and decrease euthanasia.
Examine the table below that contains the number of dogs and cats admitted to a large Florida municipal shelter over a 5-year period. The numbers are derived from the Chameleon Kennel Statistics report.
| CAT | Year 1 | Year 2 | Year 3 | Year 4 | Year 5 |
| Stray | 13,877 | 13,005 | 11,128 | 9,703 | 9,465 |
| Owner Surrender | 4,233 | 1651 | 992 | 992 | 960 |
| Total | 18,110 | 14,656 | 12,120 | 10,695 | 10,425 |
| DOG | Year 1 | Year 2 | Year 3 | Year 4 | Year 5 |
| Stray | 7,520 | 7,381 | 6,919 | 7,176 | 6,992 |
| Owner Surrender | 3,066 | 2,104 | 1,627 | 1,680 | 1,756 |
| Total | 10,586 | 9,485 | 8,546 | 8,856 | 8,748 |
| TOTAL | Year 1 | Year 2 | Year 3 | Year 4 | Year 5 |
| Dogs and cats | 28,696 | 24,141 | 20,666 | 19,551 | 19,173 |
| % Cat | 63% | 61% | 59% | 55% | 54% |
| % Dog | 37% | 39% | 41% | 45% | 46% |
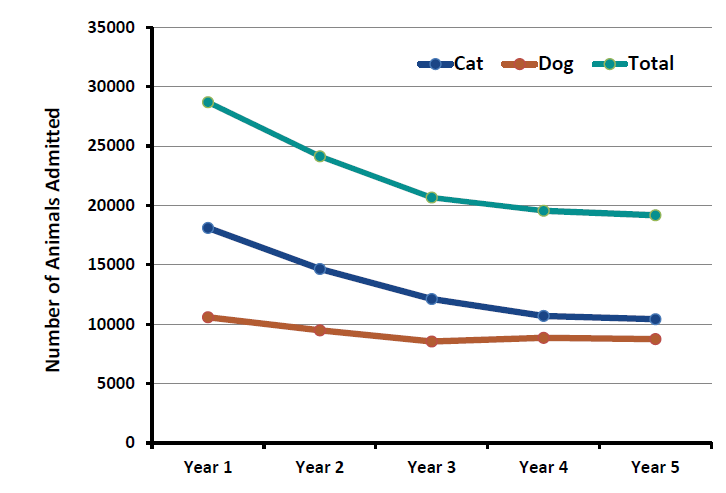
Pictures are worth a thousand words – trends in shelter intake, outcomes, and live release over time are usually best visualized in graphic format.
Here are the admissions data for the large Florida municipal shelter that were in table format now displayed as a graph.

Test Your Knowledge

